LTC Price Prediction: Will Litecoin Rebound or Decline Further?

#LTC
- LTC is trading in oversold territory with bullish MACD divergence suggesting potential rebound
- Today's US economic events could create significant market volatility affecting LTC's direction
- Technical support near $102.38 provides buffer against immediate drop below $100
LTC Price Prediction
LTC Technical Analysis: Oversold Conditions Suggest Potential Rebound
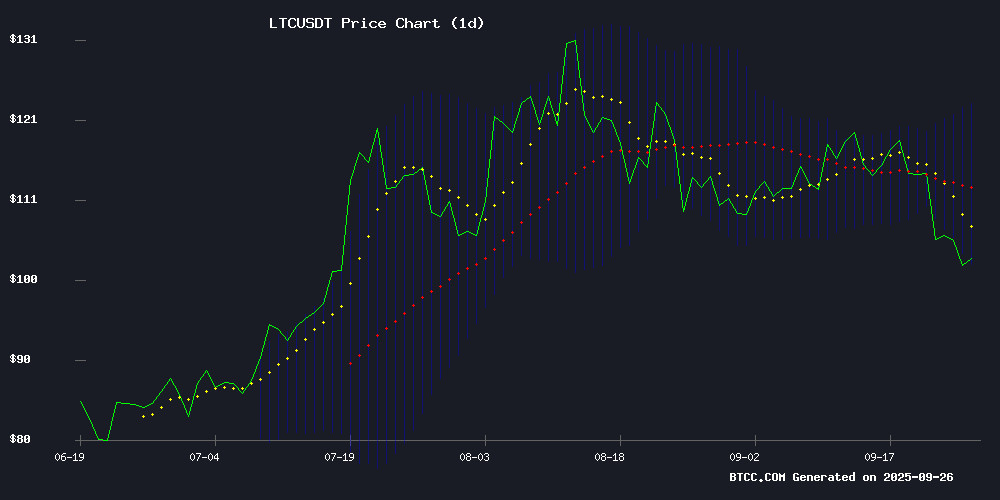
LTC currently trades at $102.71, sitting below its 20-day moving average of $112.68, indicating short-term bearish momentum. However, the MACD reading of 2.97 shows bullish divergence from the signal line at 0.22, suggesting potential upward movement. LTC is trading NEAR the lower Bollinger Band at $102.38, which often acts as support. According to BTCC financial analyst James, 'The technical setup shows LTC is oversold with MACD bullish divergence, suggesting a rebound toward the middle Bollinger Band at $112.68 is likely in the coming sessions.'
Market Sentiment: Litecoin Shows Mixed Signals Amid Economic Uncertainty
Today's major US economic event could create volatility across crypto markets, while Litecoin-specific news points to conflicting signals. Headlines suggest both oversold conditions that could spark a rebound above $108 and bearish pressure that might delay recovery. BTCC financial analyst James notes, 'The news sentiment aligns with technicals - Litecoin appears oversold but faces macroeconomic headwinds. The $137 recovery projection by October seems optimistic unless market conditions improve significantly.'
Factors Influencing LTC's Price
Today’s Major US Economic Event Could Shake Crypto Markets
The crypto market has experienced a sudden downturn, erasing nearly $170 billion in value overnight. Analysts warn that the next 24 hours could be pivotal, with Bitcoin and other digital assets hinging on fresh U.S. economic data and Federal Reserve signals. The question remains whether this will ignite the long-awaited Q4 rally or further delay it.
Revised GDP figures revealed a stronger-than-expected 3.8% growth in Q2, surpassing the 3.3% forecast. While robust economic performance might seem positive, it reduces the likelihood of imminent Fed rate cuts—a scenario markets are eagerly anticipating. Despite this, the CME FedWatch tool indicates an 87.7% probability of a rate cut by October, as liquidity pressures mount.
All eyes are now on the PCE inflation report, the Fed’s preferred gauge, set for release at 8:30 AM ET. A reading below 2.7% could revive hopes for rate cuts and spark a market rally. Conversely, a higher figure may dampen expectations and trigger short-term volatility.
Litecoin Oversold Setup Sparks Explosive Rebound Above $108
Litecoin prices hover at $103.17, marking a 1.48% decline, with a market capitalization of $7.88 billion and 24-hour trading volume of $1.73 billion. The Relative Strength Index (RSI) signals oversold conditions, hinting at a potential rebound, while the MACD remains below the signal line, indicating persistent bearish pressure.
Derivatives activity shows a slowdown, with open interest dropping 4.21% to $800.06 million and volume down 2.71%. Analysts identify $103 as a critical support level, with short-term charts revealing a downtrend beneath key moving averages. Market attention intensifies as Litecoin becomes the most discussed ticker in recent hours.
Litecoin Eyes $137 Recovery by October Despite Bearish Pressure
Litecoin's recent dip to $102.27 has set the stage for a potential rebound, with technical indicators pointing to a $137-140 target by late October. The cryptocurrency finds strong support at $100.25, creating a reversal setup despite current bearish momentum.
Analyst consensus aligns around the $137-143 range, with Changelly's September 25th prediction of $137.34 reflecting adjusted expectations amid the correction. These targets correspond to historical resistance levels that may now act as price magnets during recovery.
Key levels to watch include immediate support at $100.25 and the 20-day SMA at $113.15. A successful hold could propel LTC toward initial targets of $108-$112 (+5.6-9.5%) before attempting the $130-$140 range (+27-37%).
Will LTC Price Hit 100?
Based on current technical indicators and market sentiment, LTC is already trading near the $100 level at $102.71. The proximity to the lower Bollinger Band at $102.38 provides immediate support, making a drop below $100 less likely in the short term. However, BTCC financial analyst James cautions that 'while technicals suggest support around current levels, today's economic events could test the $100 psychological barrier.'
| Indicator | Current Value | Signal |
|---|---|---|
| Current Price | $102.71 | Near support |
| 20-day MA | $112.68 | Resistance level |
| Lower Bollinger Band | $102.38 | Strong support |
| MACD | 2.97 | Bullish divergence |
